Limble CMMS · 2024–2025
A Better Starting Point for Reporting
I led the design of four editable dashboard templates so maintenance teams could start with useful reports and adapt them to their work.
- Starting Point
- A blank dashboard was flexible, but a maintenance team had to decide what to measure before seeing useful data.
- Design Decision
- Organize the first choice around familiar maintenance jobs and keep every template editable.
- What Shipped
- Limble announced four customizable templates and more than 50 ready-to-use reports.
- My role
- Senior Product Designer
- People involved
- Maintenance teams, Product and Engineering
Limble CMMS · Reporting
A Dashboard You Can Make Your Own
Start with reports that answer a maintenance question, then adapt them to the way your team works.
- Starting Points
- Four Templates
- After Setup
- Editable Reports
In This Case
Give Teams a Starting Point They Can Change
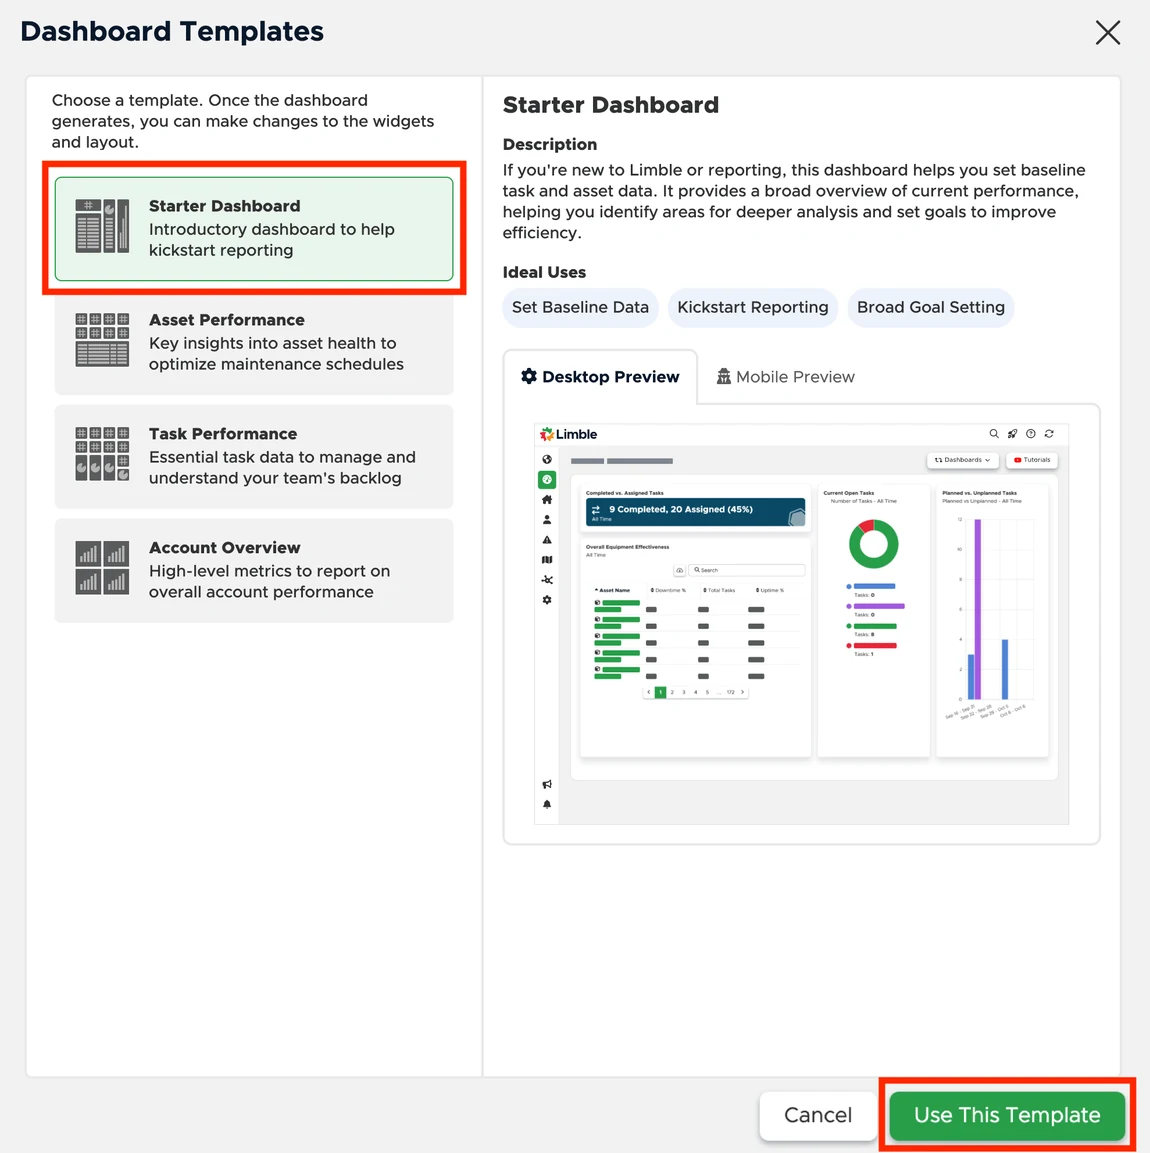
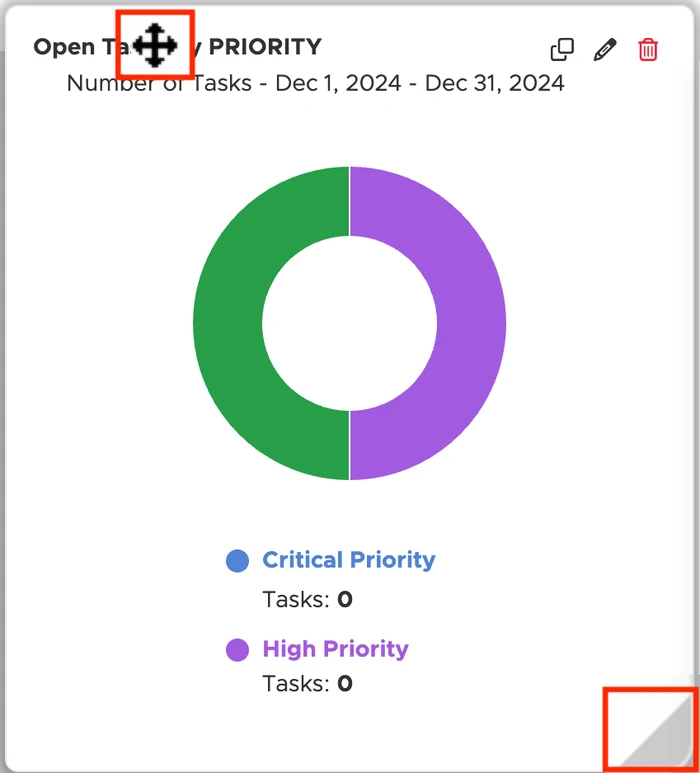
I kept the blank-dashboard option and designed a second path for teams that wanted useful reports right away. The template preview shows what a team will get. After setup, the team can move, resize, and edit widgets on the dashboard it already created.
The Cost of a Blank Dashboard
Limble’s reporting was flexible, but a maintenance team starting from a blank dashboard had to decide what to measure, choose widgets, and assemble a useful view before seeing any results. Experienced users valued that freedom. Newer users needed a credible starting point, and multi-site teams needed a way to begin consistently while leaving room for local differences.
I led design of the template library, including how templates were organized, discovered, and adapted. I worked across Product, Engineering, and design system teams and helped customer-facing teams explain the feature. I owned how templates were organized, how people found them, and what they could change once a template generated a dashboard.
Give Teams Two Ways to Start
We kept the blank-dashboard path and added a template path alongside it. I organized the library around four jobs maintenance teams already recognized. Each template provided a set of reports that teams could edit for their own operation.
System diagram
From Template to Working Dashboard
Choose a Starting Point
Start with a general dashboard or focus on assets, tasks, or an account overview.
Start with Ready-Made Reports
See what the dashboard can report before building widgets from scratch.
Make It Fit the Team
Edit reports and build on the defaults as local needs change.
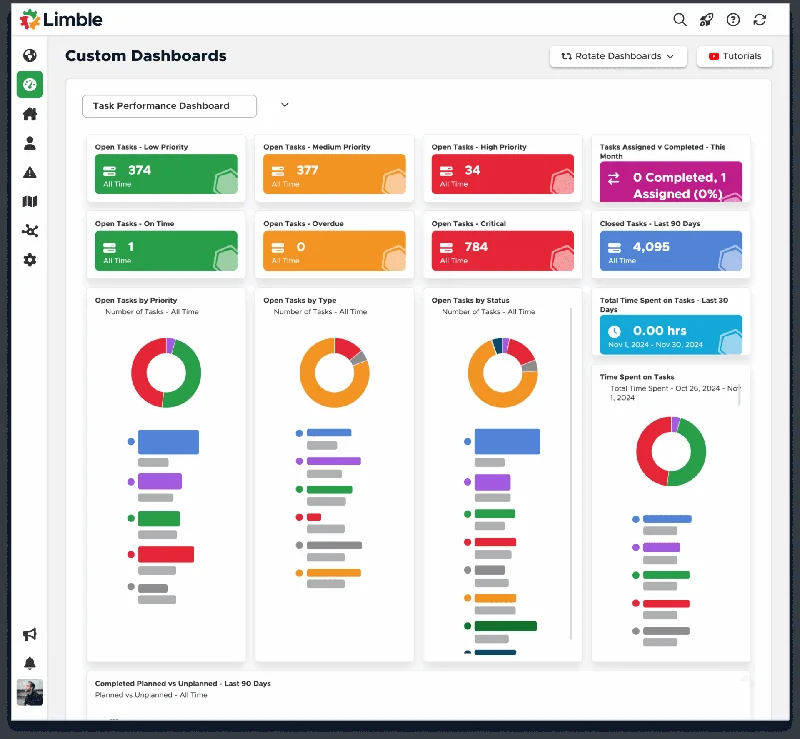
I grouped the templates by what people needed to learn about their operation. The names give teams a way to choose before they have to understand how every widget works. A site lead can start with a baseline, while someone preparing for a leadership review can go straight to the account-wide view.
Starter Dashboard
What should I track first?
- Open Tasks
- Asset Health
- Maintenance Costs
Build a baseline across equipment and work orders. Once you see what matters, add or edit reports for your location.
Asset Performance
Which equipment needs attention?
- Uptime
- Downtime
- Operating Costs
Compare equipment performance to decide which assets deserve a closer look or a change in maintenance schedule.
Task Performance
Where is the backlog building?
- Open Tasks
- Completed Tasks
- Workload
See which work is piling up and how completion is trending before deciding where to shift attention.
Account Overview
How did maintenance perform over the year?
- Task Efficiency
- Operating Costs
- Asset Health
Give leadership a shared starting point for an annual review, then tailor the reports to the questions they ask.
Carry the Report Outside the App
A related project exposed a second barrier. Customers were downloading snapshots, attaching files, and emailing them manually to people who might never open Limble. I led the design for sharing a dashboard PDF directly from the app, including to external email addresses.
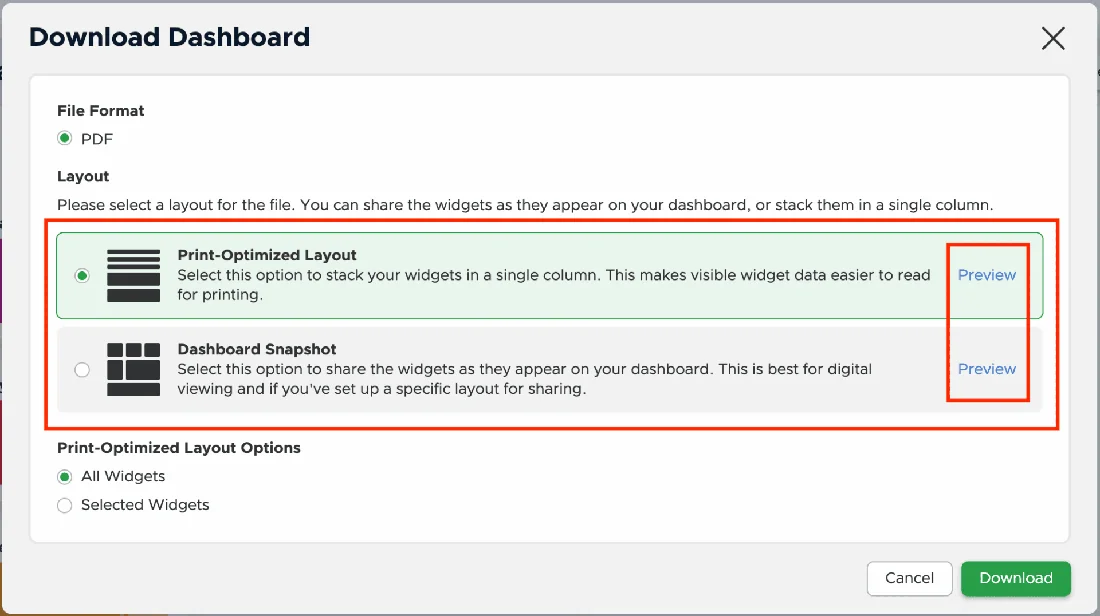
We offered two layouts for different readers. Snapshot kept the on-screen grid. Print Optimized stacked widgets in one column for reading on paper or outside the product. Senders could choose which widgets to include and preview the output before sharing. I worked with Engineering on layout behavior and error handling. Read the dashboard-sharing case.
The System Behind the Feature
My work at Limble also covered shared UI standards. I contributed to Lim-UI patterns, semantic tokens, and accessibility discussions across product trios. Those contributions were broader than the reporting release. I helped establish standards and proposed changes within a shared decision-making process.
The same principle runs through both kinds of work. A useful default gives people a way in. Editable reports and documented patterns let them carry the work forward themselves. On the product side, a maintenance lead can edit or duplicate a report as their needs change. On the team side, a shared pattern gives designers a starting point and makes deviations easier to discuss with Engineering.
“One of the things I appreciated most about Beau was his ability to untangle messy, complex problems and turn them into straightforward, easy-to-follow solutions.”
What Shipped
Limble’s March 2026 announcement describes four customizable dashboards and more than 50 reports across the release. The dashboard sharing work added direct email delivery, widget selection, preview, and two PDF layouts. That announcement documents the scope of the release. To evaluate how well the entry point works after launch, I’d look at which templates teams choose, how often they edit the first dashboard, and whether they return to it after setup.